


Known as an evolutionary smart solution for specialized automotive diagnosis, the Autel MaxiCOM MK906BT comes with MaxiVCI V100 Bluetooth Box which can communicate with vehicles wirelessly. And it combined with the best possible coverage of OE-level diagnostics, and based on the revolutionary multitask-capable Android Operating system. The MaxiCOM organizes information with test instrumentation to help you diagnose symptoms, codes, and customer complaints easily, quickly and efficiently.
This tech article is gonna share the specified tutorial of Live Data Special Function on Autel MaxiCOM MK906BT. Let’s check together now!
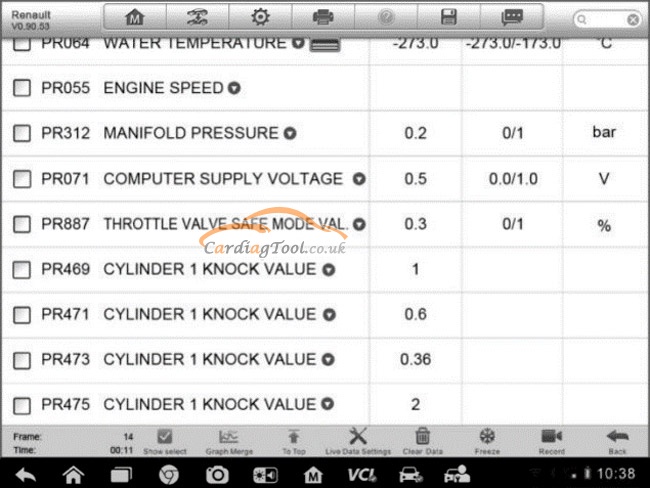
When this function is selected, the screen displays the data list for the selected module. The items available for any control module vary from one vehicle to another. The parameters display in the order that they are transmitted by the ECM, so expect variation between vehicles.
Gesture scrolling allows you to quickly move through the data list. Simply swipe the screen up or down to locate the data you want. The figure below shows a typical Live Data screen:
The following content will explain the “live data” special function to the customers who don’t know it deep enough from four main parts.
1.Diagnostics Toolbar Buttons–taps the drop-down button at the top center of the screen and the toolbar buttons will display.
2.What is its “Main Section” and how it goes in this function?l
Name Column – this column displays the parameter names.
- a) Check Box – taps the check box at the left side of the parameter name to make selection of an item. Taps the check box again to deselect the item.
- b) Drop-down Button – tapping the drop-down button at the right side of the parameter name opens a submenu, which provides various choices for data display mode.
Value Column–displays the values of the parameter items.
Range Column–displays the minimum and the maximum value.
Unit Column–displays the unit for the parameters.
To change the unit mode, tap the Setting button on the top toolbar and select a required mode.
3.Display Mode
There are 4 types of display modes available for data viewing, allowing you to view various types of parameters in the most suitable way.39
Tapping the drop-down button on the right side of the parameter name opens a submenu. There are 4 buttons to configure the data display mode, and one Help button on the right that you can tap for additional information.
Each parameter item displays the selected mode independently.
Analog Gauge Mode–displays the parameters in form of an analog meter graph
Text Mode–this is the default mode which displays the parameters in texts and shows in list format.
Important information:Reading of status parameters, such as a switch reading, which are mostly in word form, like ON, OFF, ACTIVE, and ABORT, etc., can only be displayed in Text Mode. Whereas reading of value parameters, such as a sensor reading, can be displayed in text mode and other graph modes.
Waveform Graph Mode–displays the parameters in waveform graphs
When this mode is applied, three control buttons will appear on the right side of the parameter item, allowing you to manipulate the display status.
Button-related information:
Text Button–resumes Text Display Mode
Scale Button–changes the scale values, which are displayed below the waveform graph. There are 4 scales available: x1, x2, x4 and x8.
Zoom-in Button–taps once to display the selected data graph in full screen
Digital Gauge Mode–displays the parameters in form of a digital gauge graph
Full Screen Display–this option is only available in the waveform graph mode, and mostly used in Graph Merge status for data comparison. There are three control buttons available on the top right side of the screen under this mode.
Edit Button–tapping this button opens an edit window, on which you can set the waveform color and the line thickness displayed for the selected parameter item.
Scale Button–changes the scale values, which are displayed below the waveform graph. There are 4 scales available: x1, x2, x4 and x8.
If we want to edit the waveform color and line thickness in a data graph, how can we make it?
1.Select 1 to 3 parameter items to display in Waveform Graph mode.
2.Tap the Zoom-in Button on the right to display the data graph in full screen.
3.Tap the Edit Button, and an edit window appears.
4.Select a parameter item on the left column.
5.Select a desired sample color from the second column.
6.Select a desired sample line thickness from the right column.
7.Repeat step 4-7 to edit the waveform for each parameter item.
8.Tap Done to save the setting and exit, or tap Cancel to exit without saving.
4.What’s the content of “Functional Buttons” and how to operate it?
The operations of all the available functional buttons on Live Data screen are described below:
Back – returns you to the previous screen or exit the function.
Record – starts recording the retrieved live data; the recorded data is then stored as a video clip in the Data Manager application for future reviews. This function could be triggered automatically at preset threshold value or manually as you choose, and the triggering mode and record duration can be configured in the Setting mode of Live Data.
Freeze – displays the retrieved data in freeze mode.
Previous Frame – moves to the previous frame in the freeze data.
Next Frame – moves to the next frame in the freeze data.
Resume – this button appears when the Record or Freeze function is applied. Tapping this button stops data recording, or exit freeze data mode, and resumes normal data display mode.
Flag – this button appears when the Record function is applied. Tapping this button sets flags for the recorded data at points wherever you choose. When playing back the recorded video clip later in Data Manager, the preset flag will enable a popup to allow input of text to take notes.
Clear Data–clears all previously retrieved parameter values at a cutting point whenever you choose.
To Top–moves a selected data item to the top of the list.
Graph Merge–taps this button to merge selected data graphs (for Waveform Graph Mode only). This function is very useful when making comparison between different parameters.
Important information:This mode supports Graph Merge for 2 to 3 parameter items only, so select no less than 2 or no more than 3 items each time when making graph merge.
To cancel Graph Merge mode, tap the drop-down button on the right side of the parameter name, and select a data display mode.
Show Selected/Show All–taps this option to switch between the two options; one displays the selected parameter items, the other displays all the available items.
Setting–tapping this button opens a setting screen, which allows you to set the trigger mode, recording duration, and various threshold values for data recording, and make other controls.
There are four navigation buttons on top of the Setting mode screen.
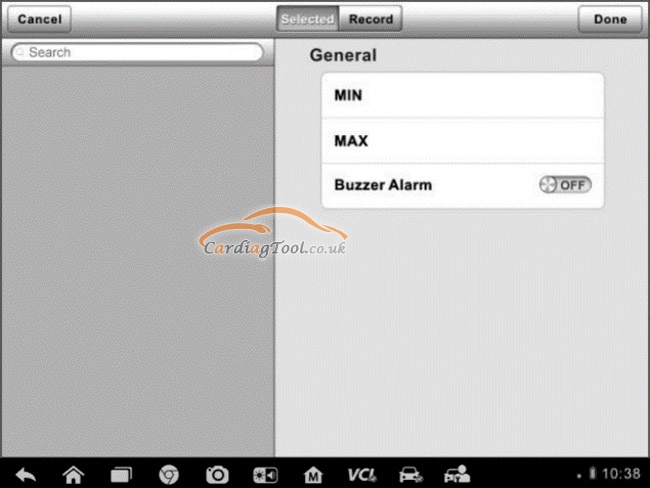
Range Button–displays the configuration screen on which you can set the threshold values, an upper limit and a lower limit, for triggering the buzzer alarm. This function is only applied to the Waveform Graph display mode.
- a) MIN–tapping which opens a virtual keyboard, allowing you to enter the required lower limit value
- b) MAX–tapping which opens a virtual keyboard, allowing you to enter the required upper limit value
- c) Buzzer Alarm–switches the alarm on and off. The alarm function makes a beep sound as a reminder whenever the data reading reaches the preset minimum or maximum point
How to set threshold limits for the parameter values?
1.Tap the Setting functional button at the bottom of the Live Data screen.
2.Tap the Range navigation button.
3.Select a parameter item on the left column, or enter the item name in the Search bar.
4.Tap on the right side of the MIN button, and enter the required minimum value.
5.Tap on the right side of the MAX button, and enter the required maximum value.
6.Tap the ON/OFF button on the right side of the Buzzer Alarm button to turn it on or off.
7.Tap Done to save the setting and return to the Live Data screen; or tap Cancel to exit without saving.
If the threshold limits are successfully set, two horizontal lines will appear on each of the data graphs (when Waveform Graph Mode is applied) to indicate the alarming point. The threshold lines are shown in different colors from the waveform of the parameters for distinction.
Record Button–displays the configuration screen for Record Setting, on which you can set the trigger type, duration and trigger point for the data recording function.
(a)Trigger Type–sets the trigger mode for data recording, mainly of two kinds: Manual and Auto. There are four options available, let’s check:
1) Manual – allows you to manually start and stop data recording
2) DTC – auto triggers data recording when any DTC is detected
3) DTC Check Mode – auto triggers data recording when certain pre-selected DTC types are detected
4) Parameter – auto triggers data recording when any parameter value reaches the preset threshold
(b) Duration – sets the recording time (for Auto trigger mode only)
(c) Trigger Point – reserves a relative percentage of a record length before the data recording start point for reference (for Auto trigger mode only)
That’s all. Thank you for sharing your time with us!
Don’t forget to contact us at:
Email: sales@CarDiagTool.co.uk
Skype: cardiag.co.uk
Whatsapp: +86 15002705698
Or leave a message at https://www.cardiagtool.co.uk/
to tell us what suggestions or questions you have about our products.